 Multiple Choice Questions
The pie chart provided below gives the distribution of land (in a village) under various food crops. Study the pie-chart carefully and answer the questions from 91 to 95.
If the total area under bajra was three hundred acres, then the total area (in hundred acres) under rice and barley together is
18
12
15
15
A.
18
Corresponding angle for rice and barely together = 72° + 36° = 108°
Corresponding angle for bajra = 18° which is equal to 300 acres.
i.e. 18° = 300 acres

The pie chart provided below gives the distribution of land (in a village) under various food crops. Study the pie-chart carefully and answer the questions from 91 to 95.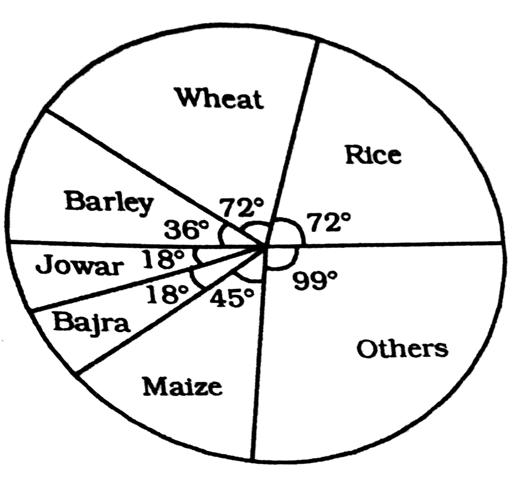
The combination of three crops which contribute to more than 50% of the total area under the food crops is
Wheat, rice and maize
Wheat, rice and jowar
wheat rice and bajra
wheat rice and bajra
The pie chart provided below gives the distribution of land (in a village) under various food crops. Study the pie-chart carefully and answer the questions from 91 to 95.
The ratio of the land used for rice and barley is
3 : 1
1 : 2
2 : 1
2 : 1
The pie chart provided below gives the distribution of land (in a village) under various food crops. Study the pie-chart carefully and answer the questions from 91 to 95.
If 10% of the land reserved for rice be distributed to wheat and barley in the ratio 2 : 1, then the angle corresponding to wheat in the new pie-chart will be
38.4°
76.8°
75.6°
75.6°
The pie chart provided below gives the distribution of land (in a village) under various food crops. Study the pie-chart carefully and answer the questions from 91 to 95.
If the production of rice is 5 times that of jowar and the production of jowar is 2 times that of bajra, then the ratio between the yield per acre of rice and bajra is
5 :2
3 : 1
4 : 1
4 : 1
The bar graph provided below represents the production of rice and wheat in different states of a country in a certain year. Answer questions 96 to 100 based on the bar graph.
The total production of rice and wheat in all the mentioned states is minimum in the state
B
C
D
D
The bar graph provided below represents the production of rice and wheat in different states of a country in a certain year. Answer questions 96 to 100 based on the bar graph.
The ratio of total production of rice in the mentioned states to that of wheat in those states, is
15 : 16
12 : 13
13 : 14
13 : 14
The bar graph provided below represents the production of rice and wheat in different states of a country in a certain year. Answer questions 96 to 100 based on the bar graph.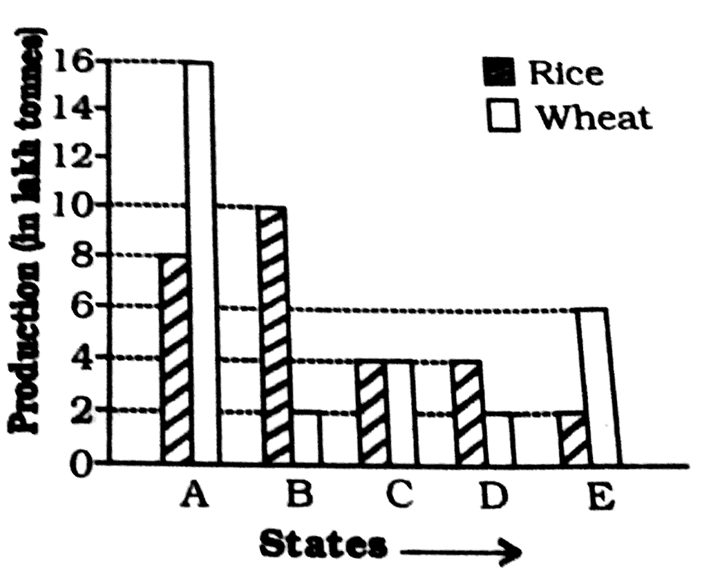
The difference between the production in rice and wheat is maximum in
A only
All of A, B and E
B and E both
B and E both
The bar graph provided below represents the production of rice and wheat in different states of a country in a certain year. Answer questions 96 to 100 based on the bar graph.
The state which is the largest producer of rice is
A
B
C
C
The bar graph provided below represents the production of rice and wheat in different states of a country in a certain year. Answer questions 96 to 100 based on the bar graph.
The average of production of rice in the mentioned states (in lakh tonnes) is
5.5
5.6
5.7
5.7


 Switch


