 Short Answer Type
 Long Answer Type
Figure 13.10 shows the effect of light on the rate of photosynthesis. Based on the graph, answer the following questions:
(a) At which point/s (A, B or C) in the curve is light a limiting factor?
(b) What could be the limiting factor/s in region A?
(c) What do C and D represent on the curve?
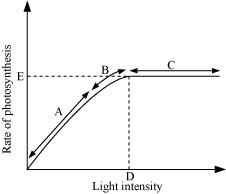
(a) Since the rate of photosynthesis doe not increase with the increase in the incident light therefore light is a limiting factor in the region B.
(b) The other limiting factors may be water, temperature, and the concentration of carbon dioxide.
(c) Point D represents the optimum point and gives the light intensity at which the maximum photosynthesis is recorded.
Ponit c represents the region where the rate of photosynthesis remains constant even after incresing the incident light.
 Multiple Choice Questions
A plant in your garden avoids photorespiratory losses, has improved water use efficiency, shows high rate of photosynthesis at high temperatures and has improved efficiency of nitrogen utilisation. In which of the following physiological groups would you assign this plant?
C4
CAM
Nitogen-fixer
Nitogen-fixer
Emerson's enhancement effect and red drop have instrumental in the discovery of
two photosystems operating simultaneously
photophosphorylation and cyclic electron transport
oxidative phosphorylation
oxidative phosphorylation
Specialised epidermal cells surrounding the guard cells are called
sunbsidiary cells
bulliform cells
lenticels
lenticels
The three boxes in this diagram represent the three major biosynthetic pathways in aerobic net reactant or products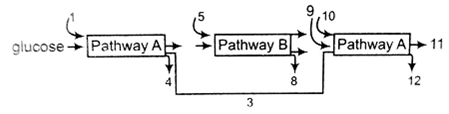
Arrows numbered 4, 8 and 12 can all be
NADH
ATP
H2O
H2O


 Switch


