 Multiple Choice Questions
Study the graph and answer the questions.
Production of 3 Different Flavours of Health Drinks of a company 6 Years in (lakh bottles)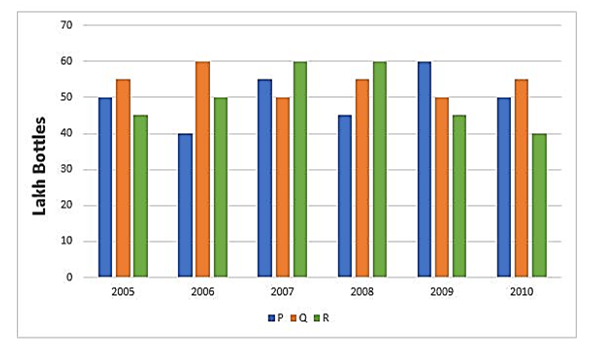
The percentage of the total production of flavour R in 2007 and 2008 with respect to the production of flavour P in 2005 and 2006 is
133.33%
97.67%
102.25%
115.35%
Study the graph and answer the questions.
Production of 3 Different Flavours of Health Drinks of a company 6 Years in (lakh bottles)
What is the difference between the average production of flavour Q in 2008, 2009 and 2010 to that of flavour P in 2005, 2006 and 2007 (in lakh bottles)?
5.5
5
50
0.5
Study the graph and answer the questions.
Production of 3 Different Flavours of Health Drinks of a company 6 Years in (lakh bottles)
In which of the following years the percentage rise or fall in production from the previous year maximum for the flavour of Q?
2010
2006
2007
2009
C.
2007
For year 2006:
Percentage increase

For year 2007:
Percentage decrease:
For year 2008:
Percentage increase:
For year 2009:

For year 2010:
Thus, maximum change is for year 2007 - 16.6% decrease.
Study the above bar graph showing the production of food grains (in million tonne).
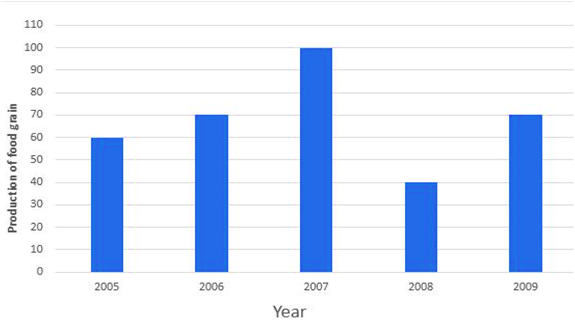
What is the ratio between the maximum production and the minimum production during the given period?
1 : 2
2 : 3
3 : 4
5 : 2
Study the following histogram and answer the following questions.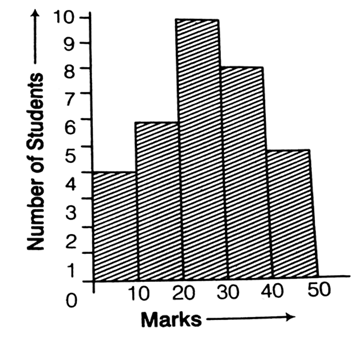
The total number of students involved in the data is
33
32
43
42
Study the following histogram and answer the following questions.
The maximum number of students got the marks in the interval of
10 - 20
20 - 30
30 - 40
40 - 50
Study the following histogram and answer the following questions.
The least number of students got the marks in the interval
40 - 50
20 - 30
10 - 20
0 - 10
Study the following histogram and answer the following questions.
The ratio of the students obtaining marks in the first and the last interval is
5 : 4
6 : 5
4 : 5
3 : 4
Study the following histogram and answer the following questions.
The difference in the amount estimated by the family on interior decoration and architect's fees is
₹ 10000
₹ 9500
₹ 7200
₹ 9600
Study the following bar diagram carefully and answer the following question.
The number of the production of electronic items (T Vs and LCDs) in a factory during the period from 2009 to 2013.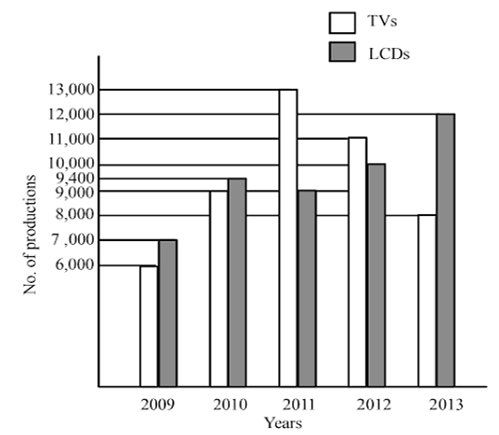
3 : 4
2 : 3
4 : 3
1 : 4


 Switch


