 Short Answer Type
Explain “large number of buyers and sellers” features of a perfectly competitive market.
Production in an economy is below its potential due to unemployment. Government starts employment generation schemes. Explain its effect using production possibilities curve.
Explain the conditions of producer’s equilibrium with the help of a numerical example.
The price elasticity of demand for a good is − 0.4. If its price increases by 5 percentage, by what percentage will its demand fall? Calculate.
Explain any two factors that affect the price elasticity of demand. Give suitable examples.
Giving reasons, state whether the following statements are true or false.
A monopolist can sell any quantity he likes at a price.
 Long Answer Type
Explain the Law of Variables Proportions with the help of total product and marginal product curves.
The law of variable proportions state that as the quantity of one factor is increased, keeping the other factors fixed, the marginal product of that factor will eventually decline. This means that up to the use of a certain amount of variable factor, marginal product of the factor may increase and after a certain stage it starts diminishing.
Assumptions of Law of Variable Proportions:
1. Constant State of Technology: First, the state of technology is assumed to be given and unchanged. If there is improvement in the technology, then the marginal product may rise instead of diminishing.
2. Fixed Amount of Other Factors: Secondly, there must be some inputs whose quantity is kept fixed. It is only in this way that we can alter the factor proportions and know its effects on output. The law does not apply if all factors are proportionately varied.
3. Possibility of Varying the Factor proportions: Thirdly, the law is based upon the possibility of varying the proportions in which the various factors can be combined to produce a product. The law does not apply if the factors must be used in fixed proportions to yield a product.
Behaviour of TP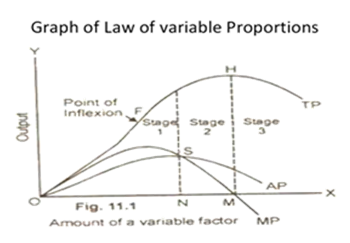
| Stages | Stage name | TP | Range |
| I | Stage of increasing return | TP increases at an increasing rate till F | From o to point F |
| II | Stage of diminishing return | Increases at a decreasing rate and attains maximum at H | From F to point H |
| III | Stage of negative return | TP starts to fall | From H onwards |
The whole production phase can be distinguished into three different production stages.
IstStage: Increasing Returns to a Factor
This stages starts from the origin point O and continues till the point of inflexion (F) on the TP curve. During this phase, TP increases at an increasing rate and is also accompanied by rising MP curve. The MP curve attains its maximum point corresponding to the point of inflexion. Throughout this stage, AP continues to rise
IIndStage: Diminishing Returns to a Factor
This stage starts from point F and continues till point H on the TP curve. During this stage, the TP increases but at a decreasing rate and attains its maximum point at H, where it remains constant. On the other hand, the MP curve continues to fall and cuts AP from its maximum point S, where MP equals AP. When TP attains its maximum point, corresponding to it, MP becomes zero. AP, in this stage initially rises, attains its maximum point at S and thereafter starts falling
IIIrdStage: Negative Returns to a Factor
This stage begins from the point H on the TP curve. Throughout this point, TP curve is falling and MP curve is negative. Simultaneously, the AP curve continues to fall and approaches the x-axis (but does not touch it).
Short Answer TypeExplain the relationship between prices of other goods and demand for the given period.


 Switch


