In this article, we’ll learn about a new package in R called ‘DT’. The default print function in R, is not an effective way to display the contents, especially in a html report. DT, is an interface to the JavaScript library Data Table. DT allows users to have interactive tables that includes searching, sorting, filtering and exporting which can be further used for any type of analysis in a report.
Installing and loading DT package
This is a short post giving steps on how to actually install R packages. Let’s suppose you want to install the DT package. Well, nothing could be easier. We just fire up an R shell and type:
> insatll.packages("DT")
> library(DT)
The R package DT provides an R interface to the JavaScript library DataTables. R data objects (matrices or data frames) can be displayed as tables on HTML pages, and DataTables provides filtering, pagination, sorting, and many other features in the tables.
Usage:
The main function in this package is datatable(). It creates an HTML widget to display R data objects with DataTables.
datatable(data, options = list(), class = "display",
    callback = JS("return table;"), rownames, colnames, container,
    caption = NULL, filter = c("none", "bottom", "top"), escape = TRUE,
    style = "default", width = NULL, height = NULL, elementId = NULL,
    fillContainer = getOption("DT.fillContainer", NULL),
    autoHideNavigation = getOption("DT.autoHideNavigation", NULL),
    selection = c("multiple", "single", "none"), extensions = list(),
    plugins = NULL, editable = FALSE)
Arguments
| Values | Description |
| data | a data object (either a matrix or a data frame) |
| options | a list of initialization options (see https://datatables.net/reference/option/); the character options wrapped in JS() will be treated as literal JavaScript code instead of normal character strings |
| class | the CSS class(es) of the table |
| callback | the body of a JavaScript callback function with the argument table to be applied to the DataTables instance (i.e. table) |
| rownames | TRUE (show row names) or FALSE (hide row names) or a character vector of row names; by default, the row names are displayed in the first column of the table if exist (not NULL) |
| colnames | if missing, the column names of the data; otherwise it can be an unnamed character vector of names you want to show in the table header instead of the default data column names |
| container | a sketch of the HTML table to be filled with data cells; by default, it is generated from htmltools::tags$table() with a table header consisting of the column names of the data |
| caption | the table caption; a character vector or a tag object generated from htmltools::tags$caption() |
| filter | whether/where to use column filters; none: no filters; bottom/top: put column filters at the bottom/top of the table; range sliders are used to filter numeric/date/time columns |
How to convert data.frame to data.table
You can convert any `data.frame` into `datatable` using datatable(df) :
> datatable(iris)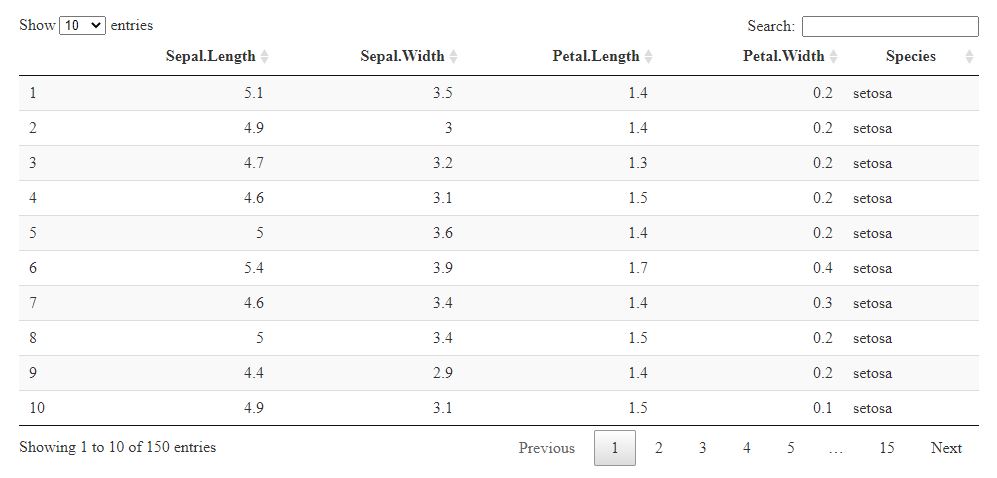
the above output will be shown in a browser by default.
Table CSS Classes
he class argument specifies the CSS classes of the table. The possible values can be found on the page of default styling options. The default value display basically enables row striping, row highlighting on mouse over, row borders, and highlighting ordered columns. You can choose a different combination of CSS classes, such as cell-border and stripe:
> datatable(head(iris), class = 'cell-border stripe')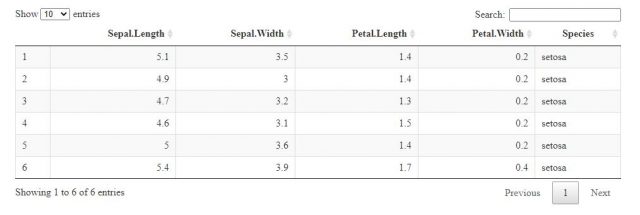
Table Editing
You can enable table editing using the argument editable (see ?DT::datatable for its possible values). Then you will be able to double-click a cell to edit its value. It works in both client-side and server-side processing modes. Below are two client-side examples:
> DT::datatable(head(iris), editable = 'cell')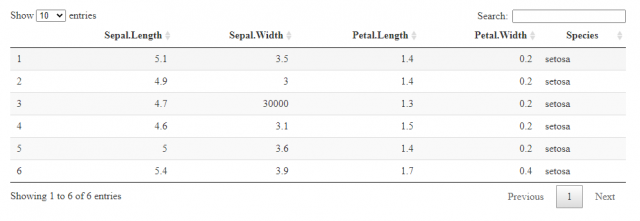
Display Row Names
If the data object has row names, they will be displayed as the first column of the table by default. You can suppress row names via the argument rownames = FALSE, and you can also change row names by providing a different character vector to rownames.
> datatable(head(mtcars))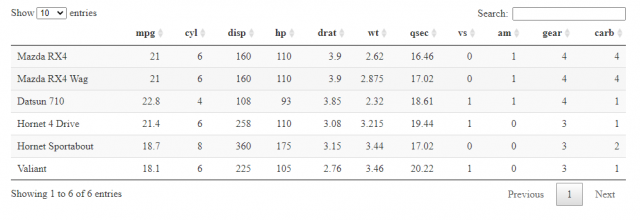
> datatable(head(mtcars), rownames = FALSE) # no row names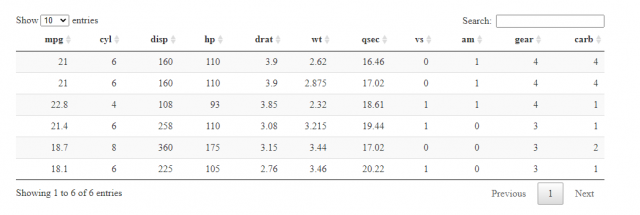
Table Caption
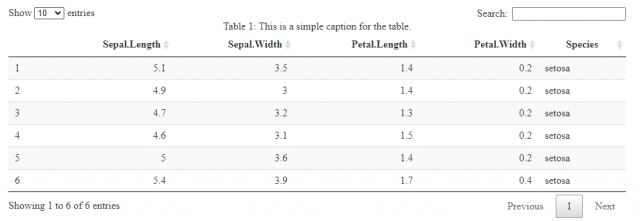
You can add a table caption via the caption argument. It can be either a character vector, or a tag object created from htmltools::tags$caption().
> datatable(
+  head(iris),
+  caption = 'Table 1: This is a simple caption for the table.'
+ )
Conclusion
Hence, we saw what is DT package in R, how to install and load DT package how to use DT package to make tables and to make them more informative with each example.
This brings the end of this Blog. We really appreciate your time.
Hope you liked it.
Do visit our page www.zigya.com/blog for more informative blogs on Data Science
Keep Reading! Cheers!
Zigya Academy
BEING RELEVANT