

What’s leaflet?
The leaflet is an open-source JavaScript library for interactive web maps. The leaflet is designed with simplicity, performance, and usability in mind. It’s lightweight, simple, and flexible, and is probably the most popular open-source mapping library at the moment.
Interaction Features
The leaflet has many features that we can easily use on our project or research as follow
- Drag panning with inertia
- Scroll wheel zoom
- Pinch-zoom on mobile
- Double click zoom
- Zoom to the area (shift-drag)
- Keyboard navigation
- Events: click, mouseover, etc.
- Marker dragging
Prerequisites
Before we begin to build the visualization, make sure we fulfil the following requirements:
- Programming language of R with several libraries, such as
leaflet,leaflet.extras, anddplyr - The data consists of location point (latitude and longitude) and additional information.
- Good internet connection.
Install Packages
We run these lines of code in the console of R Studio to install the required packages.
install.packages("tidyverse")
install.packages("leaflet")
Load Data
Next we read in our data with the read_csv() function from the tidyverse. You may need to alter the file path of your csv in the read_csv() function.
library("tidyverse")
library("leaflet")
Basic Usage
You create a Leaflet map with these basic steps:
- Create a map widget by calling
leaflet(). - Add layers (i.e., features) to the map by using layer functions (e.g.
addTiles,addMarkers,addPolygons) to modify the map widget. - Repeat step 2 as desired.
- Print the map widget to display it.
Here’s a basic example:
library(leaflet)

m <- leaflet() %>%
# Add default OpenStreetMap map tiles
  addTiles() %>%
  addMarkers(lng=77.231299, lat=28.613869, popup="Hello World")
# Print the map
m 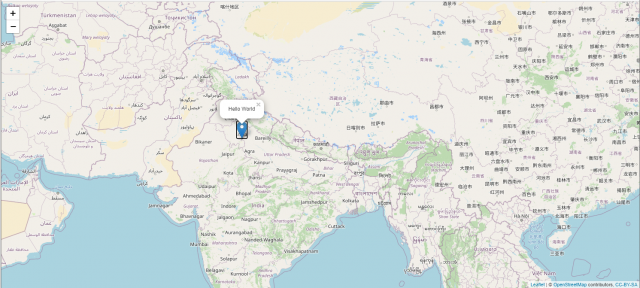
Markers
Use markers to call out points on the map. Marker locations are expressed in latitude/longitude coordinates, and can either appear as icons or as circles.
Circle Markers
Circle markers are much like regular circles, except that their radius in onscreen pixels stays constant regardless of zoom level.
You can use their default appearance:
library(leaflet)

m <- leaflet() %>%
# Add default OpenStreetMap map tiles
  addTiles() %>%
  addCircleMarkers(lng=77.231299, lat=28.613869, popup="Hello World")
# Print the map
m 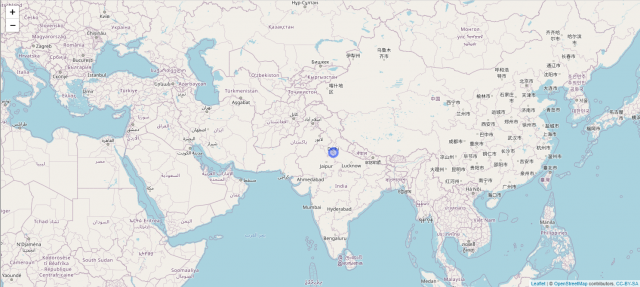
Conclusion
Hence, we saw what is leaflet, how to install and load leaflet in R, how to use leaflet, and also how to make plots in the leaflet.
This brings the end of this Blog. We really appreciate your time.
Hope you liked it.
Do visit our page www.zigya.com/blog for more informative blogs on Data Science
Keep Reading! Cheers!
Zigya Academy
BEING RELEVANT