Decision Trees are versatile Machine Learning algorithm that can perform both classification and regression tasks. They are very powerful algorithms, capable of fitting complex datasets. Besides, decision trees are fundamental components of random forests, which are among the most potent Machine Learning algorithms available today.
Applications of Decision Trees
Decision Trees are used in the following areas of applications:
- Marketing and Sales – Decision Trees play an important role in a decision-oriented sector like marketing. In order to understand the consequences of marketing activities, organizations make use of Decision Trees to initiate careful measures. This helps in making efficient decisions that help the company to reap profits and minimize losses.
- Reducing Churn Rate – Banks make use of machine learning algorithms like Decision Trees to retain their customers. It is always cheaper to keep customers than to gain new ones. Banks are able to analyze which customers are more vulnerable to leaving their business. Based on the output, they are able to make decisions by providing better services, discounts as well as several other features. This ultimately helps them to reduce the churn rate.
- Anomaly & Fraud Detection – Industries like finance and banking suffers from various cases of fraud. In order to filter out anomalous or fraud loan applications, information, and insurance fraud, these companies deploy decision trees to provide them with the necessary information to identify fraudulent customers.
- Medical Diagnosis – Classification trees identifies patients who are at risk of suffering from serious diseases such as cancer and diabetes.
What Is A Decision Tree Algorithm?
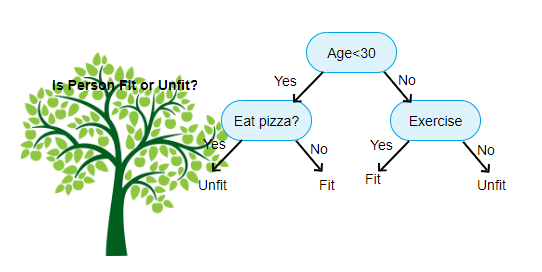
A Decision Tree is a Supervised Machine Learning algorithm that looks like an inverted tree, wherein each node represents a predictor variable (feature), the link between the nodes represents a Decision and each leaf node represents an outcome (response variable).
We will be using party package for decision tree.
Install R Package
Use the below command in R console to install the package. You also have to install the dependent packages if any.
> install.packages("party")
To create and analyze decision tree it as ctree() function.
Syntax
The basic syntax for creating a decision tree in R is −
> ctree(formula, data)
Description of the parameters used −
- formula is a formula describing the predictor and response variables.
- data is the name of the data set used.
Load Data
Loading the party library by executing library(party)
Load the dataset readingSkills and execute head(readingSkills)
> library(party)
> head(readingSkills)
  nativeSpeaker age shoeSize    score
1           yes   5 24.83189 32.29385
2           yes   6 25.95238 36.63105
3            no  11 30.42170 49.60593
4           yes   7 28.66450 40.28456
5           yes  11 31.88207 55.46085
6           yes  10 30.07843 52.83124
As you can see clearly there 4 columns nativeSpeaker, age, shoeSize, and score. Thus basically we are going to find out whether a person is a native speaker or not using the other criteria and see the accuracy of the decision tree model developed in doing so.
Decision Tree
Create the decision tree model using ctree and plot the model
> model <- ctree(nativeSpeaker ~ age + shoeSize + score, data= readingSkills)
> model

         Conditional inference tree with 8 terminal nodes

Response:  nativeSpeaker
Inputs:  age, shoeSize, score
Number of observations:  200

1) score <= 43.34602; criterion = 1, statistic = 44.243
  2) shoeSize <= 26.92283; criterion = 0.999, statistic = 13.746
    3) score <= 31.08626; criterion = 1, statistic = 25.616
      4)*  weights = 24
    3) score > 31.08626
      5) age <= 6; criterion = 1, statistic = 17.578
        6)*  weights = 22
      5) age > 6
        7) score <= 38.68543; criterion = 1, statistic = 16.809
          8)*  weights = 13
        7) score > 38.68543
          9)*  weights = 11
  2) shoeSize > 26.92283
    10)*  weights = 51
1) score > 43.34602
  11) age <= 9; criterion = 0.997, statistic = 10.843
    12)*  weights = 29
  11) age > 9
    13) score <= 50.2831; criterion = 1, statistic = 30.938
      14)*  weights = 16
    13) score > 50.2831
      15)*  weights = 34
Plotting the model.
> plot(model)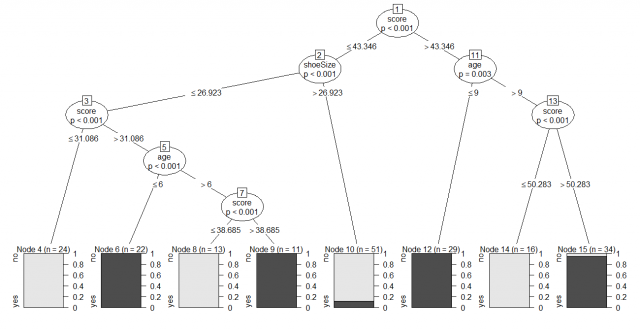
Conclusion
Therefore, we studied from the decision tree shown above, we can conclude that anyone whose readingSkills the score is less than 38.3 and age is more than 6 is not a native Speaker
This brings the end of this Blog. We really appreciate your time.
Hope you liked it.
Do visit our page www.zigya.com/blog for more informative blogs on Data Science
Keep Reading! Cheers!
Zigya Academy
BEING RELEVANT
Pretty good article. I just stumbled upon your blog and wanted to say that I have really enjoyed reading your blog posts. Any way Ill be coming back and I hope you post again soon.