
To plot more than one curve on a single plot in R, we proceed as follows. Create the first plot using the plot() function. For the subsequent plots, do not use the plot() function, which will overwrite the existing plot. Instead, each one of the subsequent curves are plotted using points() and lines() functions, whose calls are similar to the plot().
Add Points to a Plot
points is a generic function to draw a sequence of points at the specified coordinates. The specified character(s) are plotted, centered at the coordinates.
Usage
points(x, ...)
points.default(x, y=NULL, type="p", pch=1, col="black", bg=NA, cex=1, ...)
Arguments
x, y | coordinate vectors of points to plot. |
type | character indicating the type of plotting; actually any of the types as in plot(..). |
pch | plotting `character’, i.e. symbol to use. pch can either be a character or an integer code for a set of graphics symbols. The full set of S symbols is available with pch=0:18. |
col | to add color to the points. |
bg | background (“fill”) color for open plot symbols |
cex | character expansion |
Example
In the R script shown below, we plot the curves of three data sets (x,y1),(x,y2) and (x,y3) on the same plot. The code and the plot are shown here:
# create 3 datasets
> x <- c(1:7)
> y1 <- c(1,4,9,16,25,36,49)
> y2 <- c(1, 5, 12, 21, 34, 51, 72)
> y3 <- c(1, 6, 14, 28, 47, 73, 106 )
First create a plot with the first curve by using plot() function
> plot(x, y1, type="b", col="green", pch="o", ylim=c(0,110))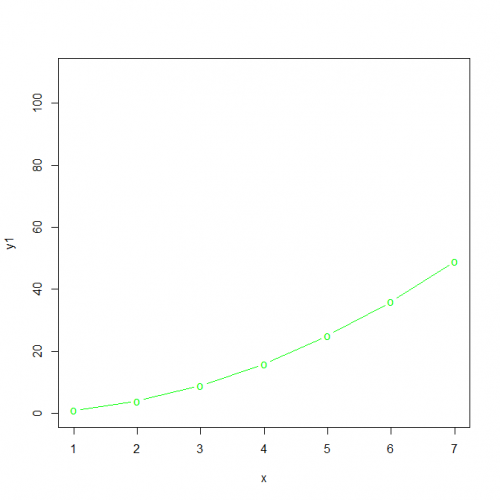
Let’s add a curve to the same plot by using points()
> points(x, y2, col="red", pch=15)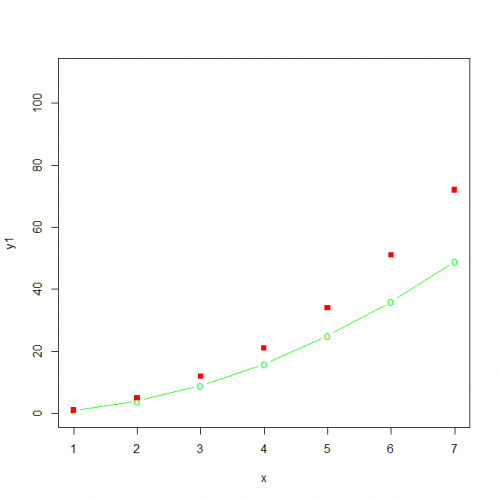
Finally lets add the third curve too y3 to the same plot.
> points(x, y3, col="blue", pch=5)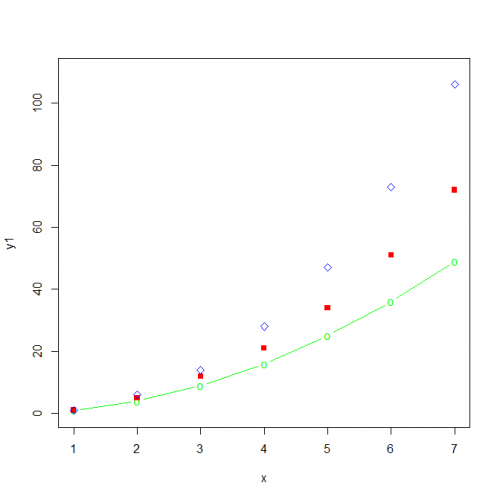
Add Lines to a Plot
In R, you add lines to a plot in a very similar way to adding points, except that you use the lines() function to achieve this.
A generic function taking coordinates given in various ways and joining the corresponding points with line segments.
Usage
lines(x, ...)
lines.default(x, y=NULL, type="l", col="red", ...)
Arguments
| x, y | coordinate vectors of points to join. |
| type | character indicating the type of plotting; actually any of the types as in plot(..) |
| col | color to use. |
Example
In the same way, let’s add the line to the above plot using lines() function
> lines(x, y2, col="red")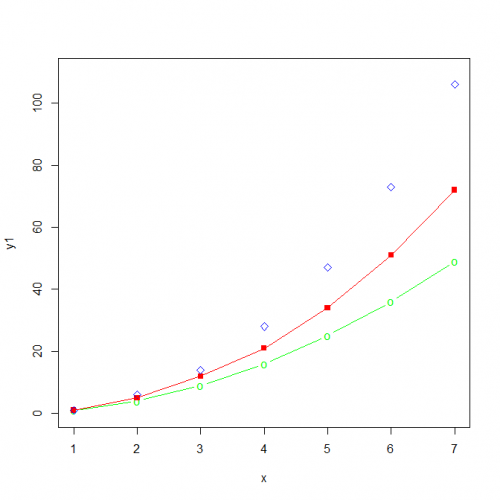
Finishing it by adding the last curve y3 to the same plot using lines() function
> lines(x, y3, col="blue")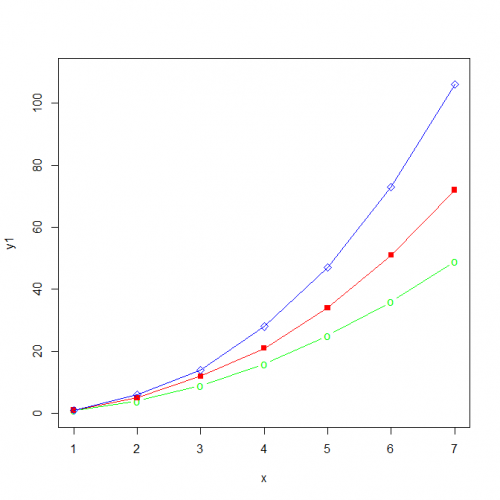
Conclusion
Hence, we saw how to add one or more point to a plot along with lines using lines() and points() function with different aesthetics to it.
This brings the end of this Blog. We really appreciate your time.
Hope you liked it.
Do visit our page www.zigya.com/blog for more informative blogs on Data Science
Keep Reading! Cheers!
Zigya Academy
BEING RELEVANT