
Today, In this article we will learn how to add a legend to a plot and make it more informative and also look at the different types of legends and will try various aesthetic manipulations in the same plot.
In general, we use these arguments inside the plot() function itself.
Usage
> legend(x, y = NULL, fill = NULL, col ="red", pch=20, bty="o", title="Legend",
         border = "black",
         ...)
Arguments
x, y | the x and y coordinates to be used to position the legend. They can be specified by keyword or in any way which is accepted by xy.coords |
fill | if specified, this argument will cause boxes filled with the specified colors. |
col | the color of points or lines appearing in the legend. |
pch | plotting ‘character’, i.e., symbol to use. This can either be a single character or an integer code for one of a set of graphic symbols. The full set of S symbols is available with pch = 0:18 |
border | the border color for the boxes (used only if fill is specified). |
bty | the type of box to be drawn around the legend. The allowed values are "o" (the default) and "n". |
bg | the background color for the legend box. (Note that this is only used if bty != "n".) |
title | a character string or length-one expression giving a title to be placed at the top of the legend. |
title.col | color for title. |
text.width | the width of the legend text in x ("user") coordinates. (Should be a single positive number even for a reversed x axis.) |
text.col | the color used for the legend text. |
xjust | how the legend is to be justified relative to the legend x location. A value of 0 means left justified, 0.5 means centered and 1 means right justified. |
yjust | the same as xjust for the legend y location. |
The Data Points
We’re going to be using the cars dataset that is built in R. To follow along with real code feel free to copy it and play around with the code as you read along.
So if we were to simply plot the dataset using just the data as the only parameter, it’d look like this:
> plot(cars)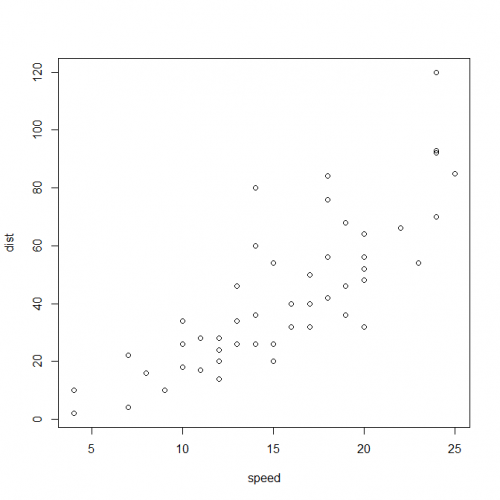
Plot Legend
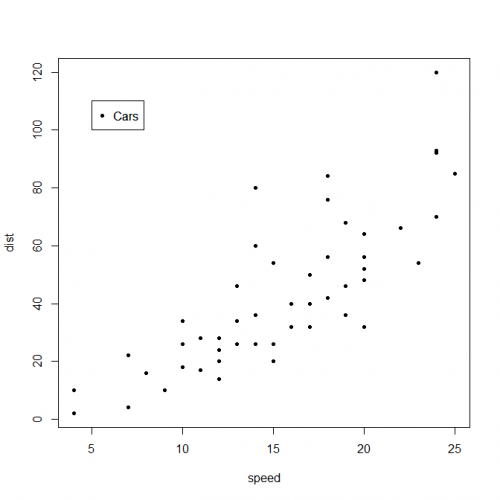
Plot legends can be called using the legend() function. The first two parameters are the x-position and y-position of the legend on the plot. You call this function right after you plot:
> plot(cars, pch="20")    # pch  is argument to set the character that will be plot
> legend(5,110,c("Cars"), pch=20)
Add legend of more than one values
In the same way, let’s create a plot for iris dataset and add a legend to it.
> head(iris)
  Sepal.Length Sepal.Width Petal.Length Petal.Width Species
1          5.1         3.5          1.4         0.2  setosa
2          4.9         3.0          1.4         0.2  setosa
3          4.7         3.2          1.3         0.2  setosa
4          4.6         3.1          1.5         0.2  setosa
5          5.0         3.6          1.4         0.2  setosa
6          5.4         3.9          1.7         0.4  setosa
Let’s create a plot for Seal.Length and Sepal.Width.
> plot(x=iris$Sepal.Width, y=iris$Sepal.Length, col=iris$Species, pch=20,
       cex=2, xlab="Sepal Width", ylab="Sepal Length", main="Iris Plot")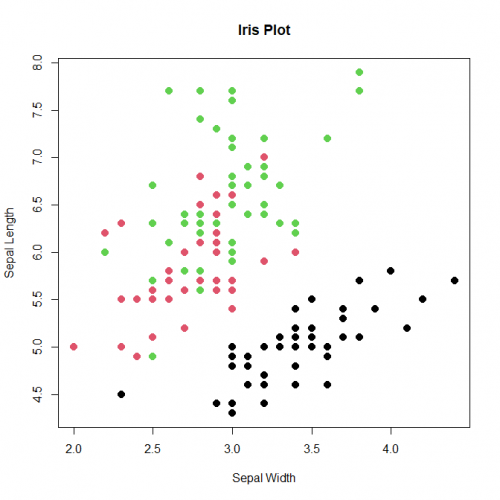
Adding legend to Iris plot
In the above plot, we can see it has three different colors, So we need to mention each color in our legend and also add a tile what the legend is about
> legend(x=3.7, y=7, legend=c("setosa", "versicolor", "virginica"),
        col=c(unique(iris$Species)), pch=20, cex=1, title="Species")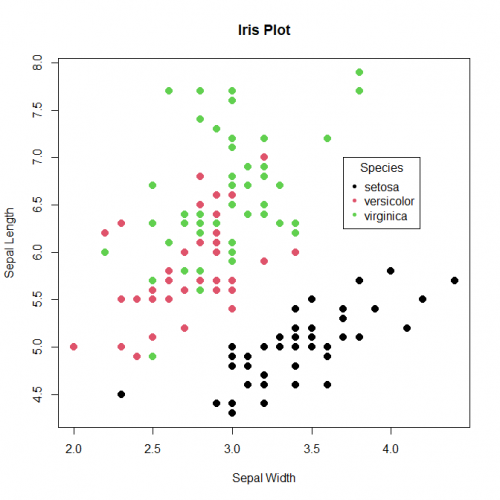
Conclusion
Hence, We saw in this article that how you can add legends to a plot and change its aesthetic to make it more informative.
This brings the end of this Blog. We really appreciate your time.
Hope you liked it.
Do visit our page www.zigya.com/blog for more informative blogs on Data Science
Keep Reading! Cheers!
Zigya Academy
BEING RELEVANT