
In this article, you’ll learn how to add text to a plot. We will also be creating a plot and will try various aesthetic manipulations in the same plot, like changing the text color.
Add texts within the plot
The text() function can be used to draw text inside the plotting area. A simplified format of the function is :
Usage
text(x, y, labels, adj = NULL, pos = NULL, offset = 0.5, vfont = NULL,
     cex = 1, col = NULL, font = NULL ...)
Arguments
x | numeric vectors specifying the x coordinates of the text to a plot |
y | numeric vectors specifying the y coordinates of the text to a plot |
label | a character vector indicating the text to be written |
adj | one or two values in [0, 1] which specify the x (and optionally y) adjustment (‘justification’) of the labels, with 0 for left/bottom, 1 for right/top, and 0.5 for centered. On most devices values outside [0, 1] will also work. |
pos | a position specifier for the text. If specified this overrides any adj value given. Values of 1, 2, 3 and 4, respectively indicate positions below, to the left of, above, and to the right of the specified (x,y) coordinates. |
offset | when pos is specified, this value controls the distance (‘offset’) of the text label from the specified coordinate in fractions of a character width. |
vfont | NULL for the current font family, or a character vector of length 2 for Hershey vector fonts. The first element of the vector selects a typeface and the second element selects a style. Ignored if labels is an expression. |
cex | numeric character expansion factor; multiplied by par("cex") yields the final character size. NULL and NA are equivalent to 1.0. |
Firstly, we need a plot so that we can add text to that plot. For this example, we are gonna mtcars dataset plot.
# Creating a plot
> plot(mtcars$wt, mtcars$mpg,
     main = " Car Weight vs. Mileage ",
     xlab = "Miles", ylab = " Weight",
     pch = 17, col = "red")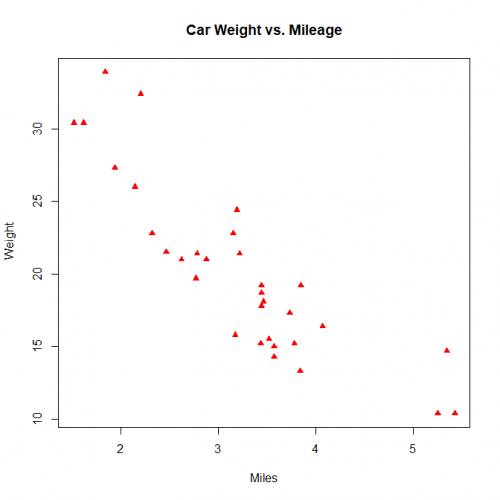
Let’s add text to the plot, adding car name to each marker in the plot.
# Adding text to the plot
> text(mtcars$wt, mtcars$mpg,  row.names(mtcars),
cex = 0.88, pos = 2, col = "grey") 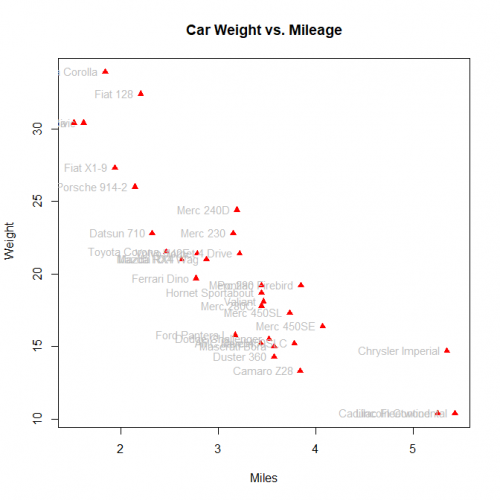
Add mathematical annotation to a plot
We can also add a mathematical annotation in the text() function, Simply by writing the expression in the expression() function.
Usage
expression(…)

is.expression(x)
as.expression(x, …)
Arguments
... | expression: R objects, typically call symbols or constants. as.expression: arguments to be passed to methods. |
x | an arbitrary R object. |
Example:
# Creating a expression
> equation <- expression(y == x^2 + 2*x + 8)

# Creating a plot
> plot(x=10, y=10, main=equation)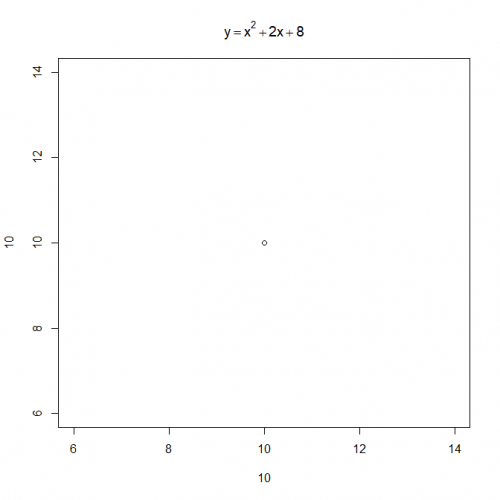
In above example the the text() function is used to add mathematical annotation to a plot.
Add text to the margins of the plot
To write text into the margins of a Plot we need to use to mtext() function. Text is written in one of the four margins of the current figure region or one of the outer margins of the device region.
Usage
> mtext(text, side = 3, line = 0, outer = FALSE, at = NULL,
      adj = NA, ...)
Arguments
text | one or more character strings or expressions. |
side | on which side of the plot (1=bottom, 2=left, 3=top, 4=right). |
line | on which MARgin line, starting at 0 countings outwards. |
outer | use outer margins if available. |
at | give location in user-coordinates. If length(at)==0 (the default), the location will be determined by adj. |
adj | adjustment for each string. For strings parallel to the axes, adj=0 means left or bottom alignment, and adj=1 means right or top alignment. |
cex | color to use. |
font | font for text. |
In the same way, let’s create a plot and give it some margin text.
# Creating a plot
> plot(x=0:10, y=20:30, main="mtext example", col.main="blue")
> mtext("this is added using mtext()", side=3, adj=0, col="red")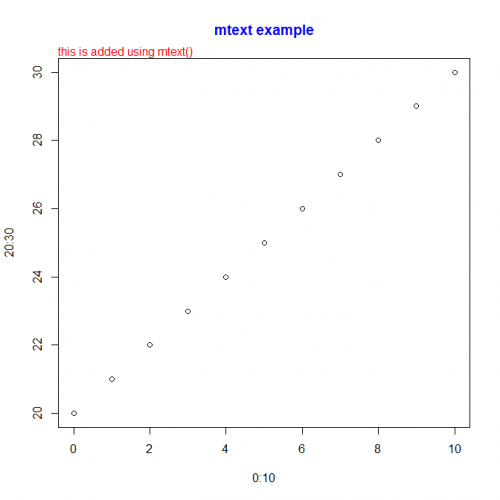
Here, in the above example, the side specifies the side of the plot such as the bottom, left, top, right. And in the given the side=3 i.e the top part of the plot and adj=1 means right or top alignment.
Conclusion
Congratulations, you learn how to add text in a plot, with how to adjust those text along with margin text with mtext() function and how to write expressions using expression() function.
This brings the end of this Blog. We really appreciate your time.
Hope you liked it.
Do visit our page www.zigya.com/blog for more informative blogs on Data Science
Keep Reading! Cheers!
Zigya Academy
BEING RELEVANT