
In this article, you’ll learn how to change the type of a plot in R. We will also be creating an example plot and will make the type changes to the same existing plot for better understanding.
In this article, you’ll learn how to change the type of a plot in R. We will also be creating an example plot and will make the type changes to the same existing plot for better understanding.
Different Plot Types
You can change the type of plot that gets drawn by using the type argument.
Here’s a list of all the different types that you can use.
| Value | Description |
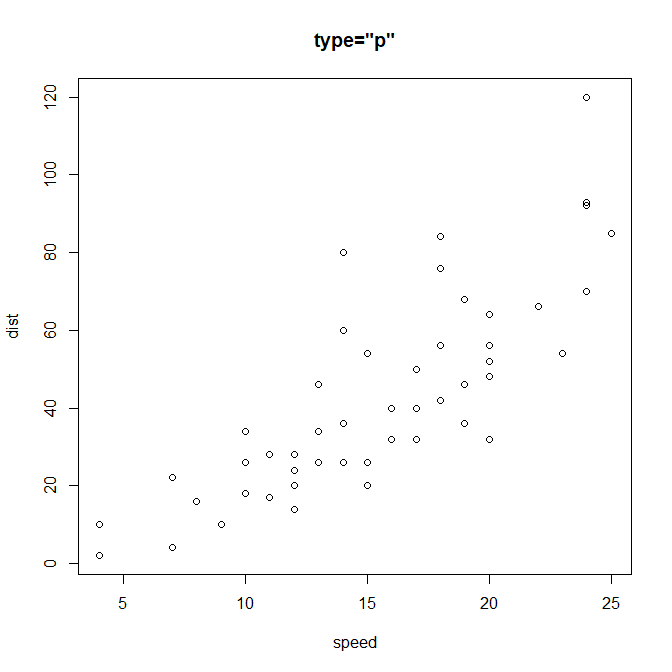
| “p” | Points |
| “l” | Lines |
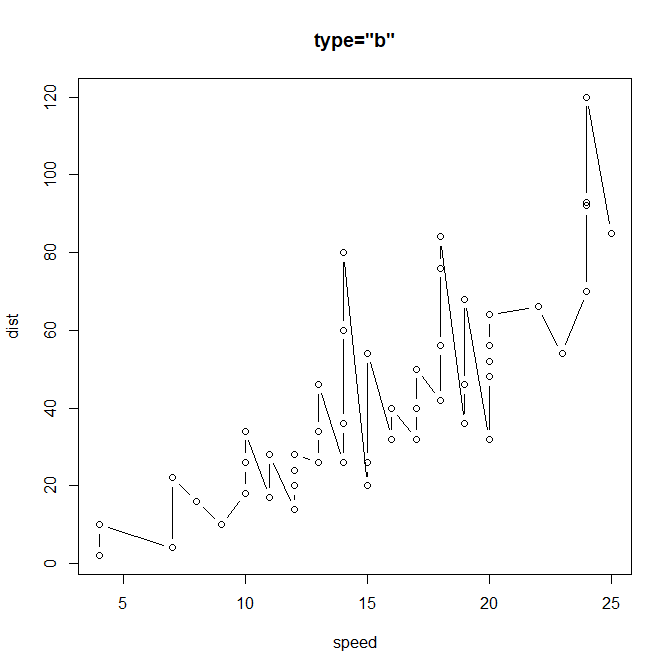
| “b” | Both points and lines |
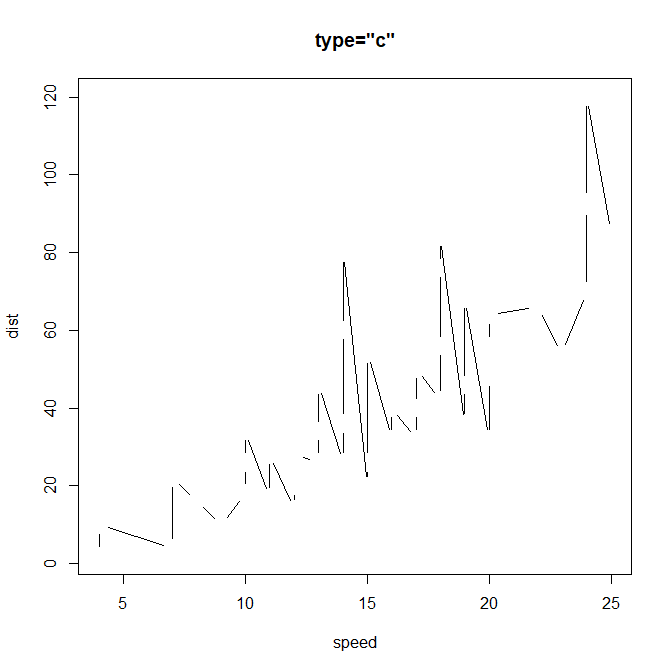
| “c” | The lines part alone of “b” |
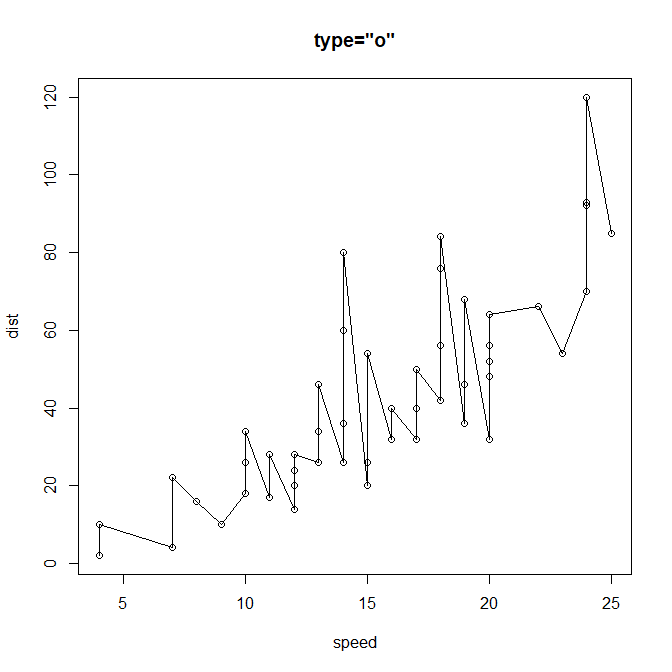
| “o” | Both points and lines “overplotted” |
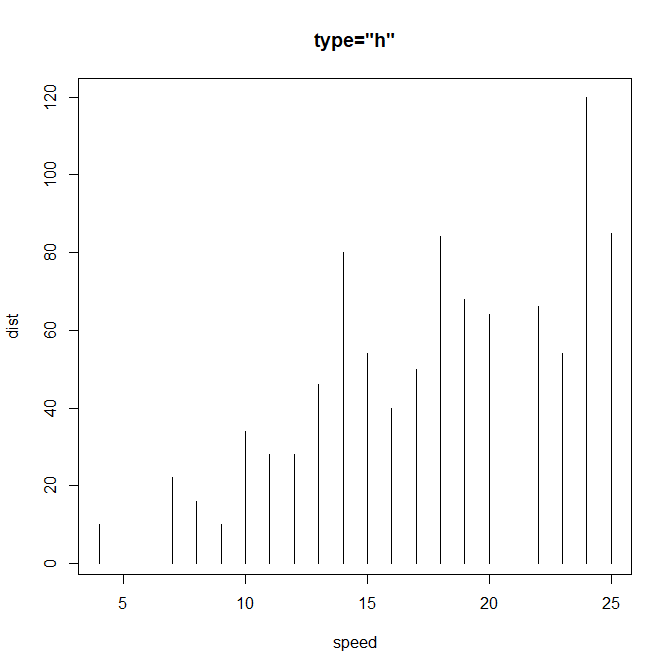
| “h” | Histogram like (or high‐density) vertical lines |
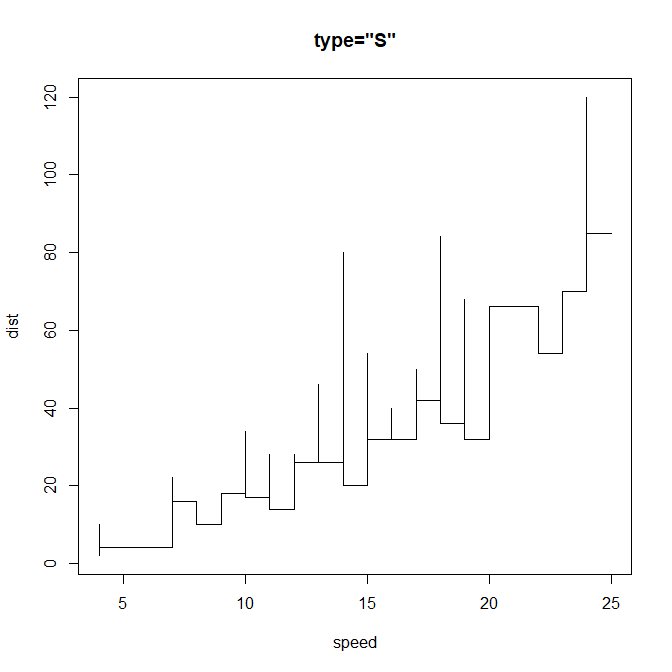
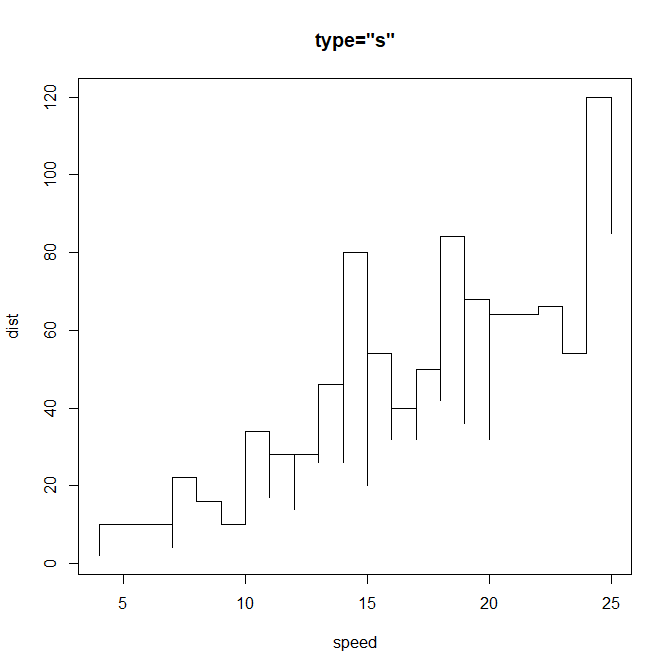
| “s” | Step plot (horizontal first) |
| “S” | Step plot (vertical first) |
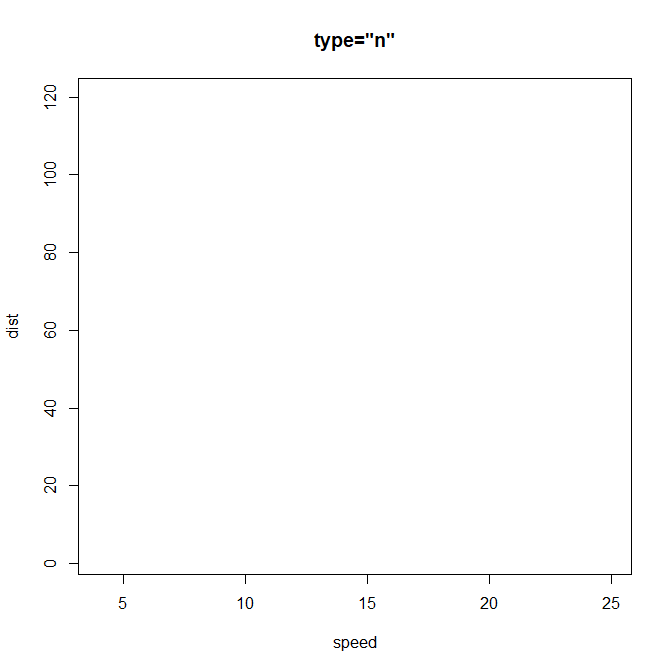
| “n” | No plotting |
For using the above arguments, the syntax for the code is given below:
Example
> plot(cars, type="l", main='type="l"')
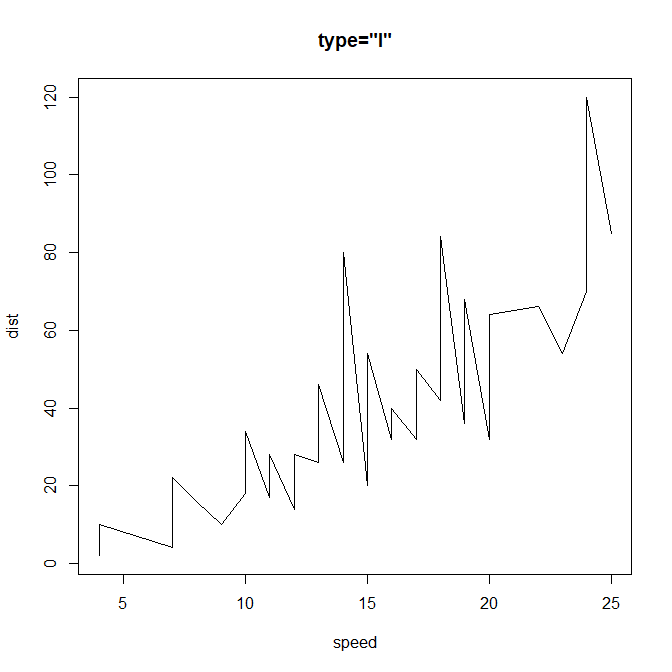
The code written above will make a plot with only the points and therefore can be altered by changing the type (type=””).
Conclusion
Hence, we studied in this article about the different types of plot.
This brings the end of this Blog. We really appreciate your time.
Hope you liked it.
Do visit our page www.zigya.com/blog for more informative blogs on Data Science
Keep Reading! Cheers!
Zigya Academy
BEING RELEVANT