In this article, you’ll learn how to box plot in R. We will also be creating an example plot and will make various changes to the same existing plot for better understanding.
The box-whisker plot (or a boxplot) is a quick and easy way to visualize complex data where you have multiple samples.
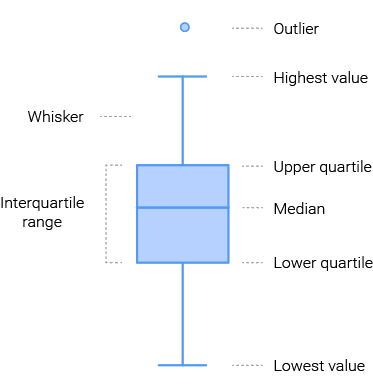
A box plot is a good way to get an overall picture of the data set in a compact manner.
You can use the boxplot() function to create box-whisker plots.
It has many options and arguments to control many things, such as the making it horizontal, adding labels, titles and colors.
Usage
> boxplot(x, names, xlab, ylab, border, col, notch, horizontal,
          add,…)
Arguments
| Value | Description |
x | A vector of values from which the boxplots are to be produced |
names | Group labels to be printed under each boxplot |
xlab | The label for the x-axis |
ylab | The label for the y axis |
border | A vector of colors for the outlines of the boxplots |
col | The foreground color of symbols as well as lines |
notch | if TRUE, a notch is drawn in each side of the boxes |
horizontal | Set it to TRUE to draw the box-plot horizontally |
add | Set it to TRUE to add boxplot to current plot |
Create a Box Plot
To get started with plot, you need a set of data to work with. Let’s consider the built-in ToothGrowth data set as an example data set.
> head(ToothGrowth)
   len supp dose
1  4.2   VC  0.5
2 11.5   VC  0.5
3  7.3   VC  0.5
4  5.8   VC  0.5
5  6.4   VC  0.5
6 10.0   VC  0.5
To create a box plot just specify any variable of the data set in boxplot() function.
> boxplot(ToothGrowth$len)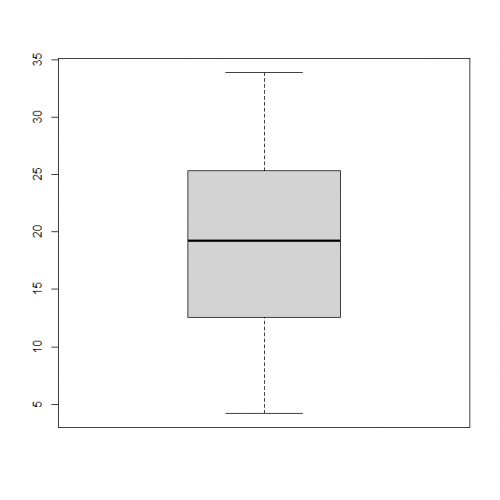
Create Notched Box Plot
The notched box plot allows you to assess whether the medians are different. If the notches do not overlap, there is strong evidence (95% confidence) their medians differ.
You add notches to a box plot by setting the notch argument to TRUE.
> boxplot(ToothGrowth$len,
        notch = TRUE)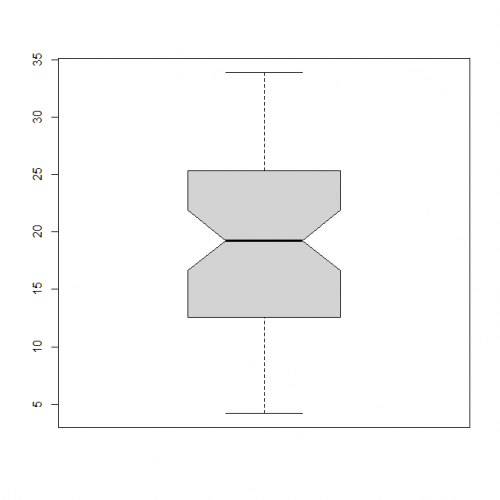
Side-by-Side Box Plots
Frequently your informational index contains a numeric variable (quantitative variable) and a factor (clear cut variable). It tends to be very dreary to discover whether the numeric variable changes as per the degree of the factor.
In R, you can do this by using the boxplot() function with a formula:
boxplot(x ~ f)Here, x is the numeric variable and f is the factor.
> boxplot(data = ToothGrowth, len ~ dose)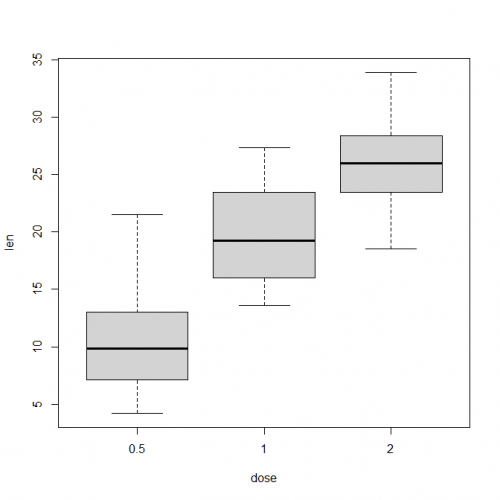
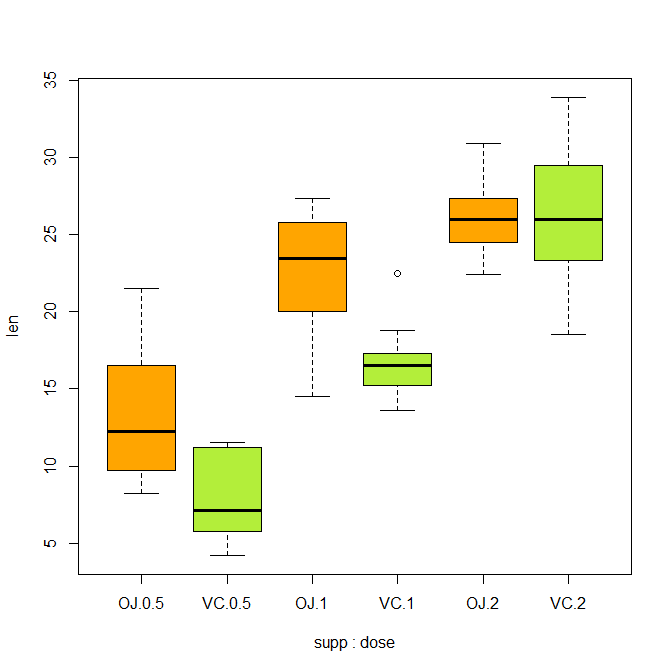
Grouped Box Plot
A gathered box plot is utilized when you have a mathematical variable, a few gatherings and subgroups.
You can create a grouped box plot by putting the interaction of two categorical variables on the x-axis and a numeric variable on the y-axis.
The interaction of two variables is indicated by separating their names with an asterisk *
> boxplot(data = ToothGrowth, len ~ supp*dose,
         col = c("orange1", "olivedrab2"))
Add Means to a Box Plot
The even line in a container plot in the middle, not the mean.
The middle alone won’t assist you with the comprehension if the information is ordinarily circulated. In this way, you need to include mean markers in your crate plot.
> boxplot(len ~ dose, data=ToothGrowth,
        col="dodgerblue1")
> mean_val <- by(ToothGrowth$len, ToothGrowth$dose, mean)
> points(mean_val, col="green", pch=20, cex=2)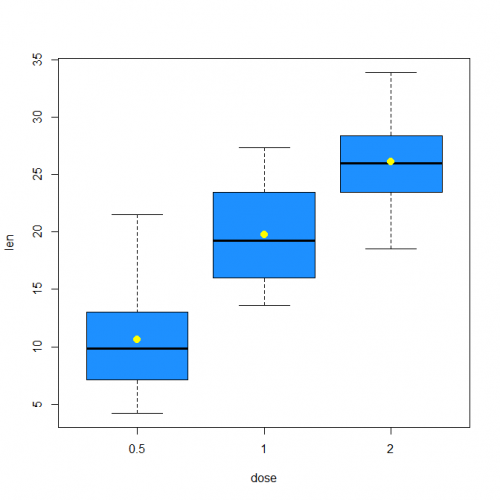
Conclusion
Hence, we studied in this article. What is a box plot, how to make a box plot with boxplot() function and also how to we saw different types of arguments in boxplot. Which can help to make your plot more informative.
This brings the end of this Blog. We really appreciate your time.
Hope you liked it.
Do visit our page www.zigya.com/blog for more informative blogs on Data Science
Keep Reading! Cheers!
Zigya Academy
BEING RELEVANT