

In this article, you’ll learn to use the plot function in R. We will also be creating our very own first plot.
The most used plotting function in R programming is the plot() function. It is a generic function, meaning, it has many methods which are called according to the type of object passed to plot().
In the simplest case, we can pass in a vector and we will get a scatter plot of magnitude vs index. But generally, we pass in two vectors and a scatter plot of these points is plotted.
Usage
plot(x, y = NULL, type="p", pch= "5", col="blue", xlim = NULL, ylim = NULL,
     main = NULL, xlab = NULL, ylab = NULL,
 ...)
Arguments
x | the coordinates of points in the plot. Alternatively, a single plotting structure, function or any R object with a plot method can be provided. |
y | the y coordinates of points in the plot, optional if x is an appropriate structure. |
type | 1-character string giving the type of plot desired. Example “p” – points “l” – lines. |
pch | plotting ‘character’, i.e., symbol to use. This can either be a single character or an integer code for one of a set of graphic symbols. The full set of S symbols is available with pch = 0:18 |
xlim | the x limits (x1, x2) of the plot. Note that x1 > x2 is allowed and leads to a “reversed axis”. |
ylim | the y limits of the plot. |
col | color for the plotting “character”. The default is "black". |
main | an overall title for the plot. The default is "XY plot". |
ylab | a title for the y-axis. The default is "Outcome". |
xlab | a title for the x-axis. The default is "Condition". |
sub | a sub title for the plot. |
Create a Plot with random values
To illustrate this plot we first need x and y values to plot the plot.
Here some random numbers were generated to make a plot.
# Set a seed values to get same random sequence
#
> set.seed(101)
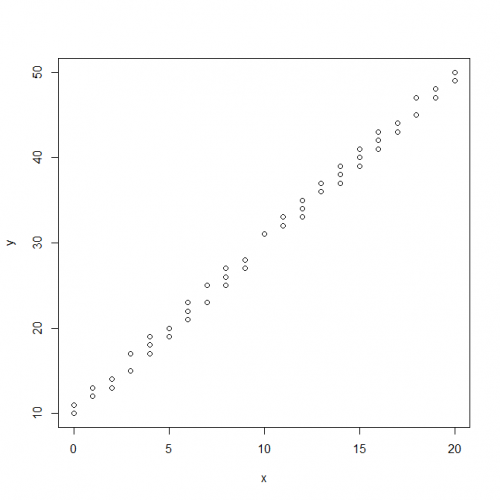
> x <- round(runif(100, 0, 20))
> y <- round(runif(100, 10, 50))
> plot(x, y)The set. seed() function sets the starting number used to generate a sequence of random numbers – it ensures that you get the same result if you start with that same seed each time you run the same process.
The runif() function generates random values of the uniform distribution and is used as runif(n, min = 0, max = 1) . We can easily generate n number of random samples within any interval, defined by the min and the max argument.
Now, What we see here is a default plot generated by R. As you can see the symbols are by default chosen as a circle, color is by default black, and axes ranges and labels are also chosen by default.
Let’s Create a Simple Plot
We need a set of data to work with to create a plot.
Subsequently, consider the built-in pressure dataset as an example dataset. It contains observations of the vapor pressure of mercury over a range of temperatures.
# Bulit in DataSet pressure
> pressure
   temperature pressure
1            0   0.0002
2           20   0.0012
3           40   0.0060
4           60   0.0300
5           80   0.0900
6          100   0.2700
7          120   0.7500
8          140   1.8500
9          160   4.2000
10         180   8.8000
11         200  17.3000
12         220  32.1000
13         240  57.0000
14         260  96.0000
15         280 157.0000
16         300 247.0000
17         320 376.0000
18         340 558.0000
19         360 806.0000
Now to convert this into a plot we can directly pass the data frame to plot() function and it will take column values as x and y-axis and name the columns as the label for each axis.
# Default plot of pressure dataset
> plot(pressure)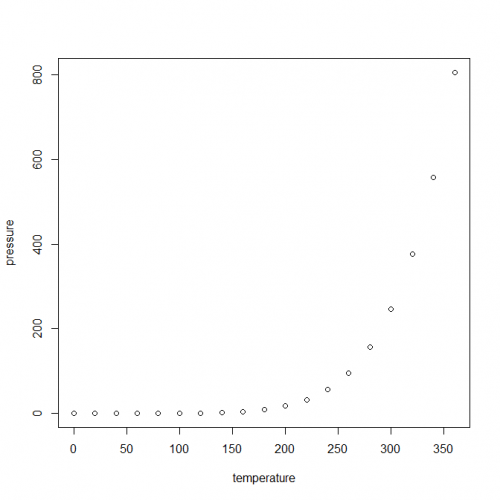
Congratulations
In conclusion, We studied about the plot() function in R, along with various examples.
This brings the end of this Blog. We really appreciate your time.
Hope you liked it.
Do visit our page www.zigya.com/blog for more informative blogs on Data Science
Keep Reading! Cheers!
Zigya Academy
BEING RELEVANT