
Multi-panel plots and figures are used everywhere, especially in scientific papers to compare different graphs or datasets. And creating them has never been easier using R!
There are several functions and ways in which you can create multi-panel plots/figures, and in this “quick guide” I will show you how to use the layout() function (available in the base installation) to create them.
layout divides the device up into as many rows and columns as there are in a matrix mat, with the column-widths and the row-heights specified in the respective arguments.
Usage
> layout(mat, widths = rep.int(1, ncol(mat)),
       heights = rep.int(1, nrow(mat)), respect = FALSE)

> layout.show(n = 1)
Arguments
| mat | a matrix object specifying the location of the next N figures on the output device. Each value in the matrix must be 0 or a positive integer. |
| widths | a vector of values for the widths of columns on the device. Relative widths are specified with numeric values. |
| heights | a vector of values for the heights of rows on the device. Relative and absolute heights can be specified, see widths above. |
| respect | either a logical value or a matrix object. If the latter, then it must have the same dimensions as mat and each value in the matrix must be either 0 or 1. |
| n | number of figures to plot. |
| x | a dimension to be interpreted as a number of centimeters. |
Let’s create a simple multi panel plot
For this example, we are going to take built in mtcars dataset and we are going to plot 2 plot side by side with the help of layout() function.
> layout(matrix(c(1,2), 1, 2, byrow = TRUE))
> plot(mtcars$hp, mtcars$mpg, col="pink", pch=15, main="Plot1")
> plot(mtcars$hp, mtcars$wt, col="blue", pch=17, main="Plot2")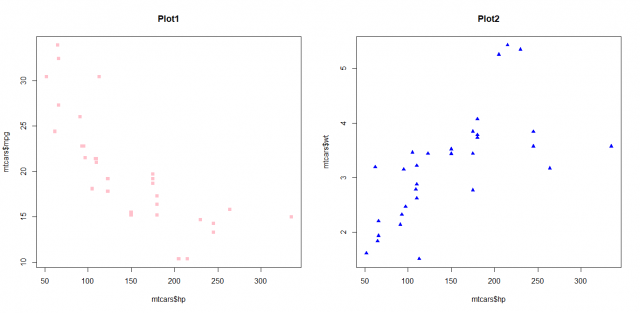
Here, as you can see me need to first define the matrix for our layout in this case we wanted to make a matrix of 1 row and 2 columns, and that why we wrote matrix(c(1, 2), 1, 2, byrow=TRUE))
Now let’s make a 2 row by 2 columns multi-panel plot
For this example, we are going to take same built in mtcars dataset and we are going to plot 2×2 row plot with the help of layout() function.
> layout(matrix(c(1,2,3,4), 2, 2, byrow = TRUE))
> plot(mtcars$hp, mtcars$mpg, col="darkgreen", main="Plot1", type="h")
> plot(mtcars$hp, mtcars$mpg, col="purple", pch="x", main="Plot2")
> plot(mtcars$hp, mtcars$wt, col="blue", pch=16, main="Plot3")
> plot(mtcars$mpg, mtcars$wt, col="orange", pch=16, main="Plot4")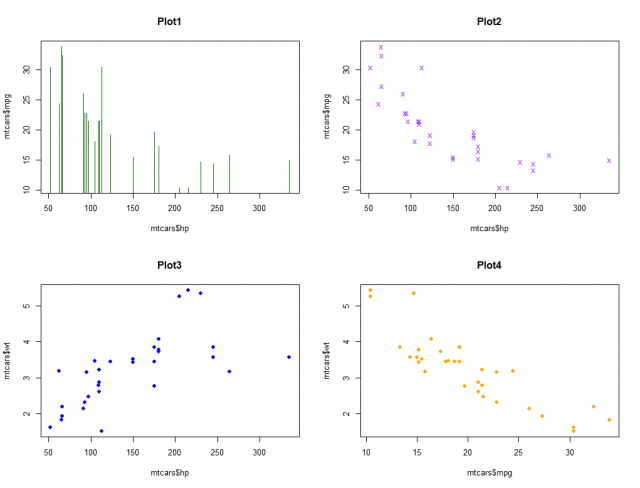
Conslusion
Hence, we studied how to use layout() function to create multi-panel plots along with various options to it.
This brings the end of this Blog. We really appreciate your time.
Hope you liked it.
Do visit our page www.zigya.com/blog for more informative blogs on Data Science
Keep Reading! Cheers!
Zigya Academy
BEING RELEVANT