

You can easily add the main title and axis labels with arguments to the plot() function in R to enhance the quality of your graphic.
Usage
plot(x, y, main = NULL, xlab = NULL, ylab = NULL ...)Arguments
x | the coordinates of points in the plot. Alternatively, a single plotting structure, function or any R object with a plot method can be provided. |
y | the y coordinates of points in the plot, optional if x is an appropriate structure. |
main | an overall title for the plot. The default is "XY plot". |
ylab | a title for the y-axis. The default is "Outcome". |
xlab | a title for the x-axis. The default is "Condition". |
First we need data
Let’s create data for our plot
Here some values which we will use to make a plot.
# Create data
> x <- c(1:10)
> y <- x*x
Once, we have the values ready we can start creating our plot.
# Create a plot the data we just generated
> plot(x, y)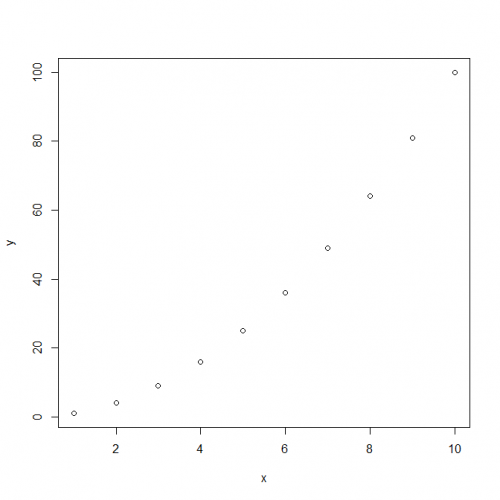
Now, as you can see it is a default plot with no title not proper x and y labels too.
Likewise, we will now add labels and titles to our plot. We need three arguments
main: Main plot title
xlab: x-axis label
ylab: y-axis label
Let’s add title as “y=x^2 plot” and label the axis.
> plot(x, y, main="y=x^2 plot", xlab="x axis", ylab="y axis")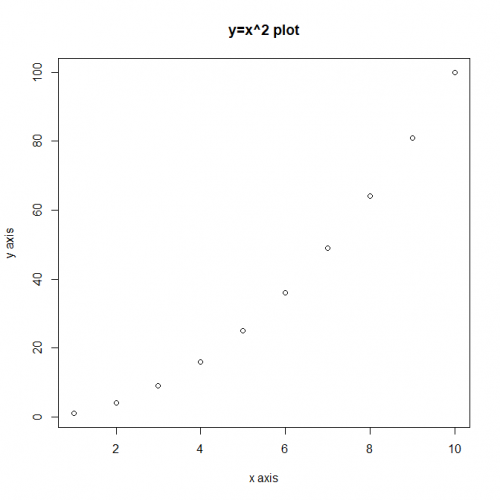
Colclusion
Hence, we studied how to label axis and add titles to a plot using plot() function in R.
This brings the end of this Blog. We really appreciate your time.
Hope you liked it.
Do visit our page www.zigya.com/blog for more informative blogs on Data Science
Keep Reading! Cheers!
Zigya Academy
BEING RELEVANT