
In this tutorial, we will learn about Normal Distribution in R. We will cover different functions which helps in generating the normal distribution. Along with this, we will also include graphs for easy representation and understanding.
Generally, it is observed that the collection of random data from independent sources is distributed normally. We get a bell shape curve on plotting a graph with the value of the variable on the horizontal axis and the count of the values in the vertical axis. The centre of the curve represents the mean of the dataset.
Details
If mean or sd are not specified they assume the default values of 0 and 1, respectively.
The normal distribution has density
f(x) = 1/(√(2 π) σ) e^-((x – μ)^2/(2 σ^2))
where μ is the mean of the distribution and σ the standard deviation.
Usage
> dnorm(x, mean = 0, sd = 1)
> pnorm(q, mean = 0, sd = 1)
> qnorm(p, mean = 0, sd = 1)
> rnorm(n, mean = 0, sd = 1)
Arguments:
| Parameter | Description |
|---|---|
| x, q | It is a vector of numbers. |
| p | It is a vector of probabilities. |
| n | It is a vector of observations. |
| mean | It is the mean value of the sample data whose default value is zero. |
| sd | It is the standard deviation whose default value is 1. |
Value
dnorm gives the density, pnorm gives the distribution function, qnorm gives the quantile function, and rnorm generates random deviates.
The length of the result is determined by n for rnorm, and is the maximum of the lengths of the numerical arguments for the other functions.
The numerical arguments other than n are recycled to the length of the result. Only the first elements of the logical arguments are used.
For sd = 0 this gives the limit as sd decreases to 0, a point mass at mu. sd < 0 is an error and returns NaN.
Let’s look at each one of them with an example.
dnorm():
The dnorm() function of R calculates the height of the probability distribution at each point for a given mean and standard deviation. The probability density of the normal distribution is:
# Creating a sequence of numbers between -10 and 10 incrementing by 0.1.
> x <- seq(-10, 10, by = 0.1)
# Creating dnorm for the mean as 0 and standard deviation as 1.0
> y <- dnorm(x, mean = 0, sd = 1.0)
# Ploting the graph
> plot(x,y, main = "dnorm Normal Distribution", col= "steelblue")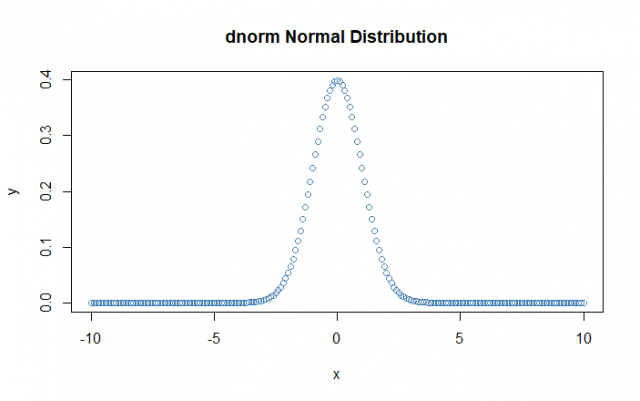
The dnorm() function is also known as “Cumulative Distribution Function”.
pnorm():
This function calculates the probability of a normally distributed random numbers, which is less than the value of a given number. The cumulative distribution is as follows:
# Creating a sequence of numbers between -10 and 10 incrementing by 0.1.
> x <- seq(-10, 10, by = 0.1)
# Creating pnorm for the mean as 0 and standard deviation as 1.0
> y <- pnorm(x, mean = 0, sd = 1.0)
# Ploting the graph
> plot(x,y, main = "pnorm Normal Distribution", col= "steelblue")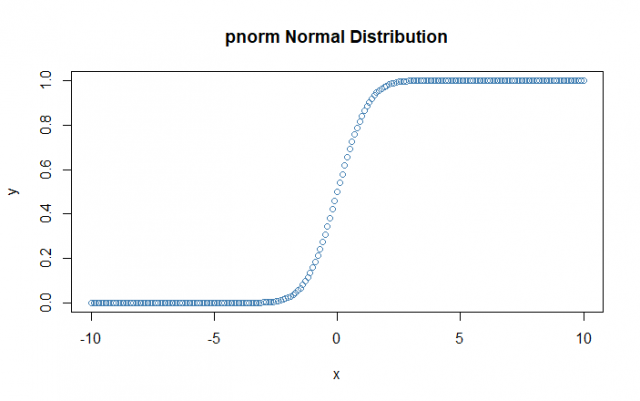
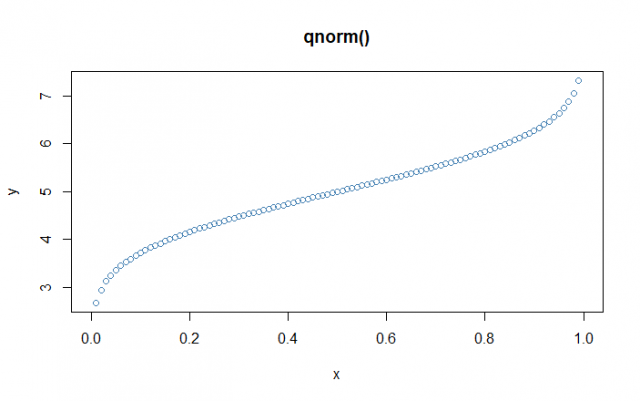
qnorm():
The qnorm() function takes the probability value as an input and calculates a number whose cumulative value matches with the probability value. The cumulative distribution function and the inverse cumulative distribution function are related by
# Creating a sequence of numbers between 0 and 1 incrementing by 0.01
> x <- seq(0, 1, by = 0.01)
# Creating qnorm for the mean as 5 and standard deviation as 1.0
> y <- qnorm(x, mean = 5, sd = 1.0)
# Plotting the graph
> plot(x,y, main = "qnorm()", col= "steelblue")
rnorm():
The rnorm() function is used for generating normally distributed random numbers. This function generates random numbers by taking the sample size as an input. Let’s see an example in which we draw a histogram for showing the distribution of the generated numbers.
# Creating a rnorm of mean of 500 and standard deviation of 10
# for 100 obervation
> x <- rnorm(100, mean = 500, sd = 10)
# Plotting a histogarm for the x vector
> hist(x, main="rnorm", col="steelblue")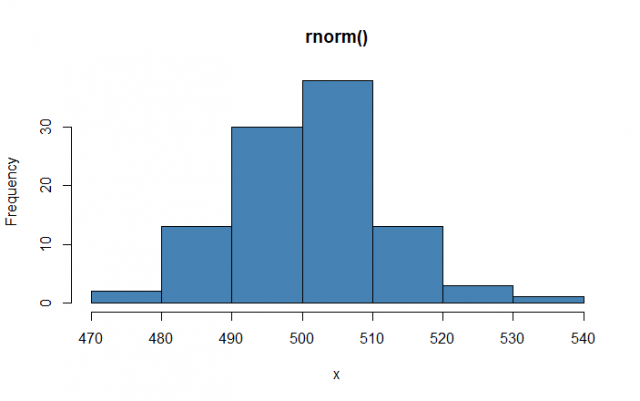
Conclusion
Hence, we studied all four types of normal distribution dnorm() , pnorm() , qnorm() , rnorm() and also how to use each one of them with an example.
This brings the end of this Blog. We really appreciate your time.
Hope you liked it.
Do visit our page www.zigya.com/blog for more informative blogs on Data Science
Keep Reading! Cheers!
Zigya Academy
BEING RELEVANT